
My Role:
Product Design
Year:
2023
Domain:
B2B
Time to read:
15 Minutes
/ About
n. 01

What is DAP?
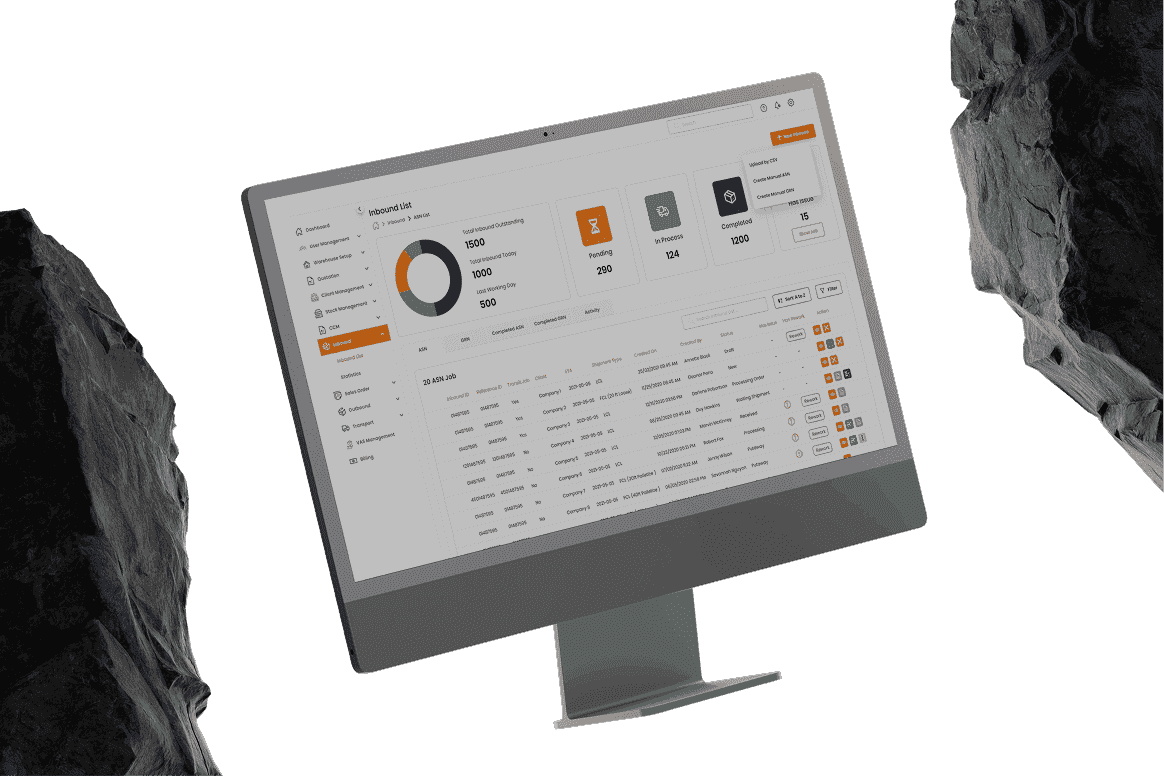
DAP is an enterprise web-based WMS for inbound operations, including Advanced Shipping Notice (ASN) creation, Goods Received Note (GRN) verification, dynamic filtering, and inbound exception handling. It reduced ASN creation errors by 65% and cut warehouse receiving-dock processing time from 45 minutes to 12 minutes per shipment.
/ CHALLENGE
n. 02
The Problem
High Information Density & Complex Data Tables: Inbound operations require tracking dozens of attributes simultaneously (PO numbers, SKU quantities, batch codes, carrier details, receiving dock schedules). Legacy screens suffered from extreme visual clutter.

Receiving Mismatches & Variance Handling:
Physical shipments rarely match digital records 100% (damaged items, missing boxes, over-deliveries). The system previously lacked a clear visual mechanism to handle line-item exceptions during GRN creation.


Cross-Role Communication Gap:
Desktop warehouse managers had limited visibility into real-time actions taken by floor operators on the mobile app during dock receiving, so need to structure web platform is connect and related to mobile app operators.
/ USER PERSONAS
n. 03
User Personas
Warehouse Operations
Monitor overall receiving velocity, resolve receiving exceptions, approve GRNs.
Logistics Driver

/ RESEARCH APPROACH
n. 04

Research approach
To align the inbound experience with floor-level operational reality, I led a user-centered research initiative. I mapped user intent across all target audience segments to establish a unified information architecture—anchored on four core pillars—and conducted a comprehensive competitive analysis.
Competitor Analysis Matrix:


Solutions by Deny:
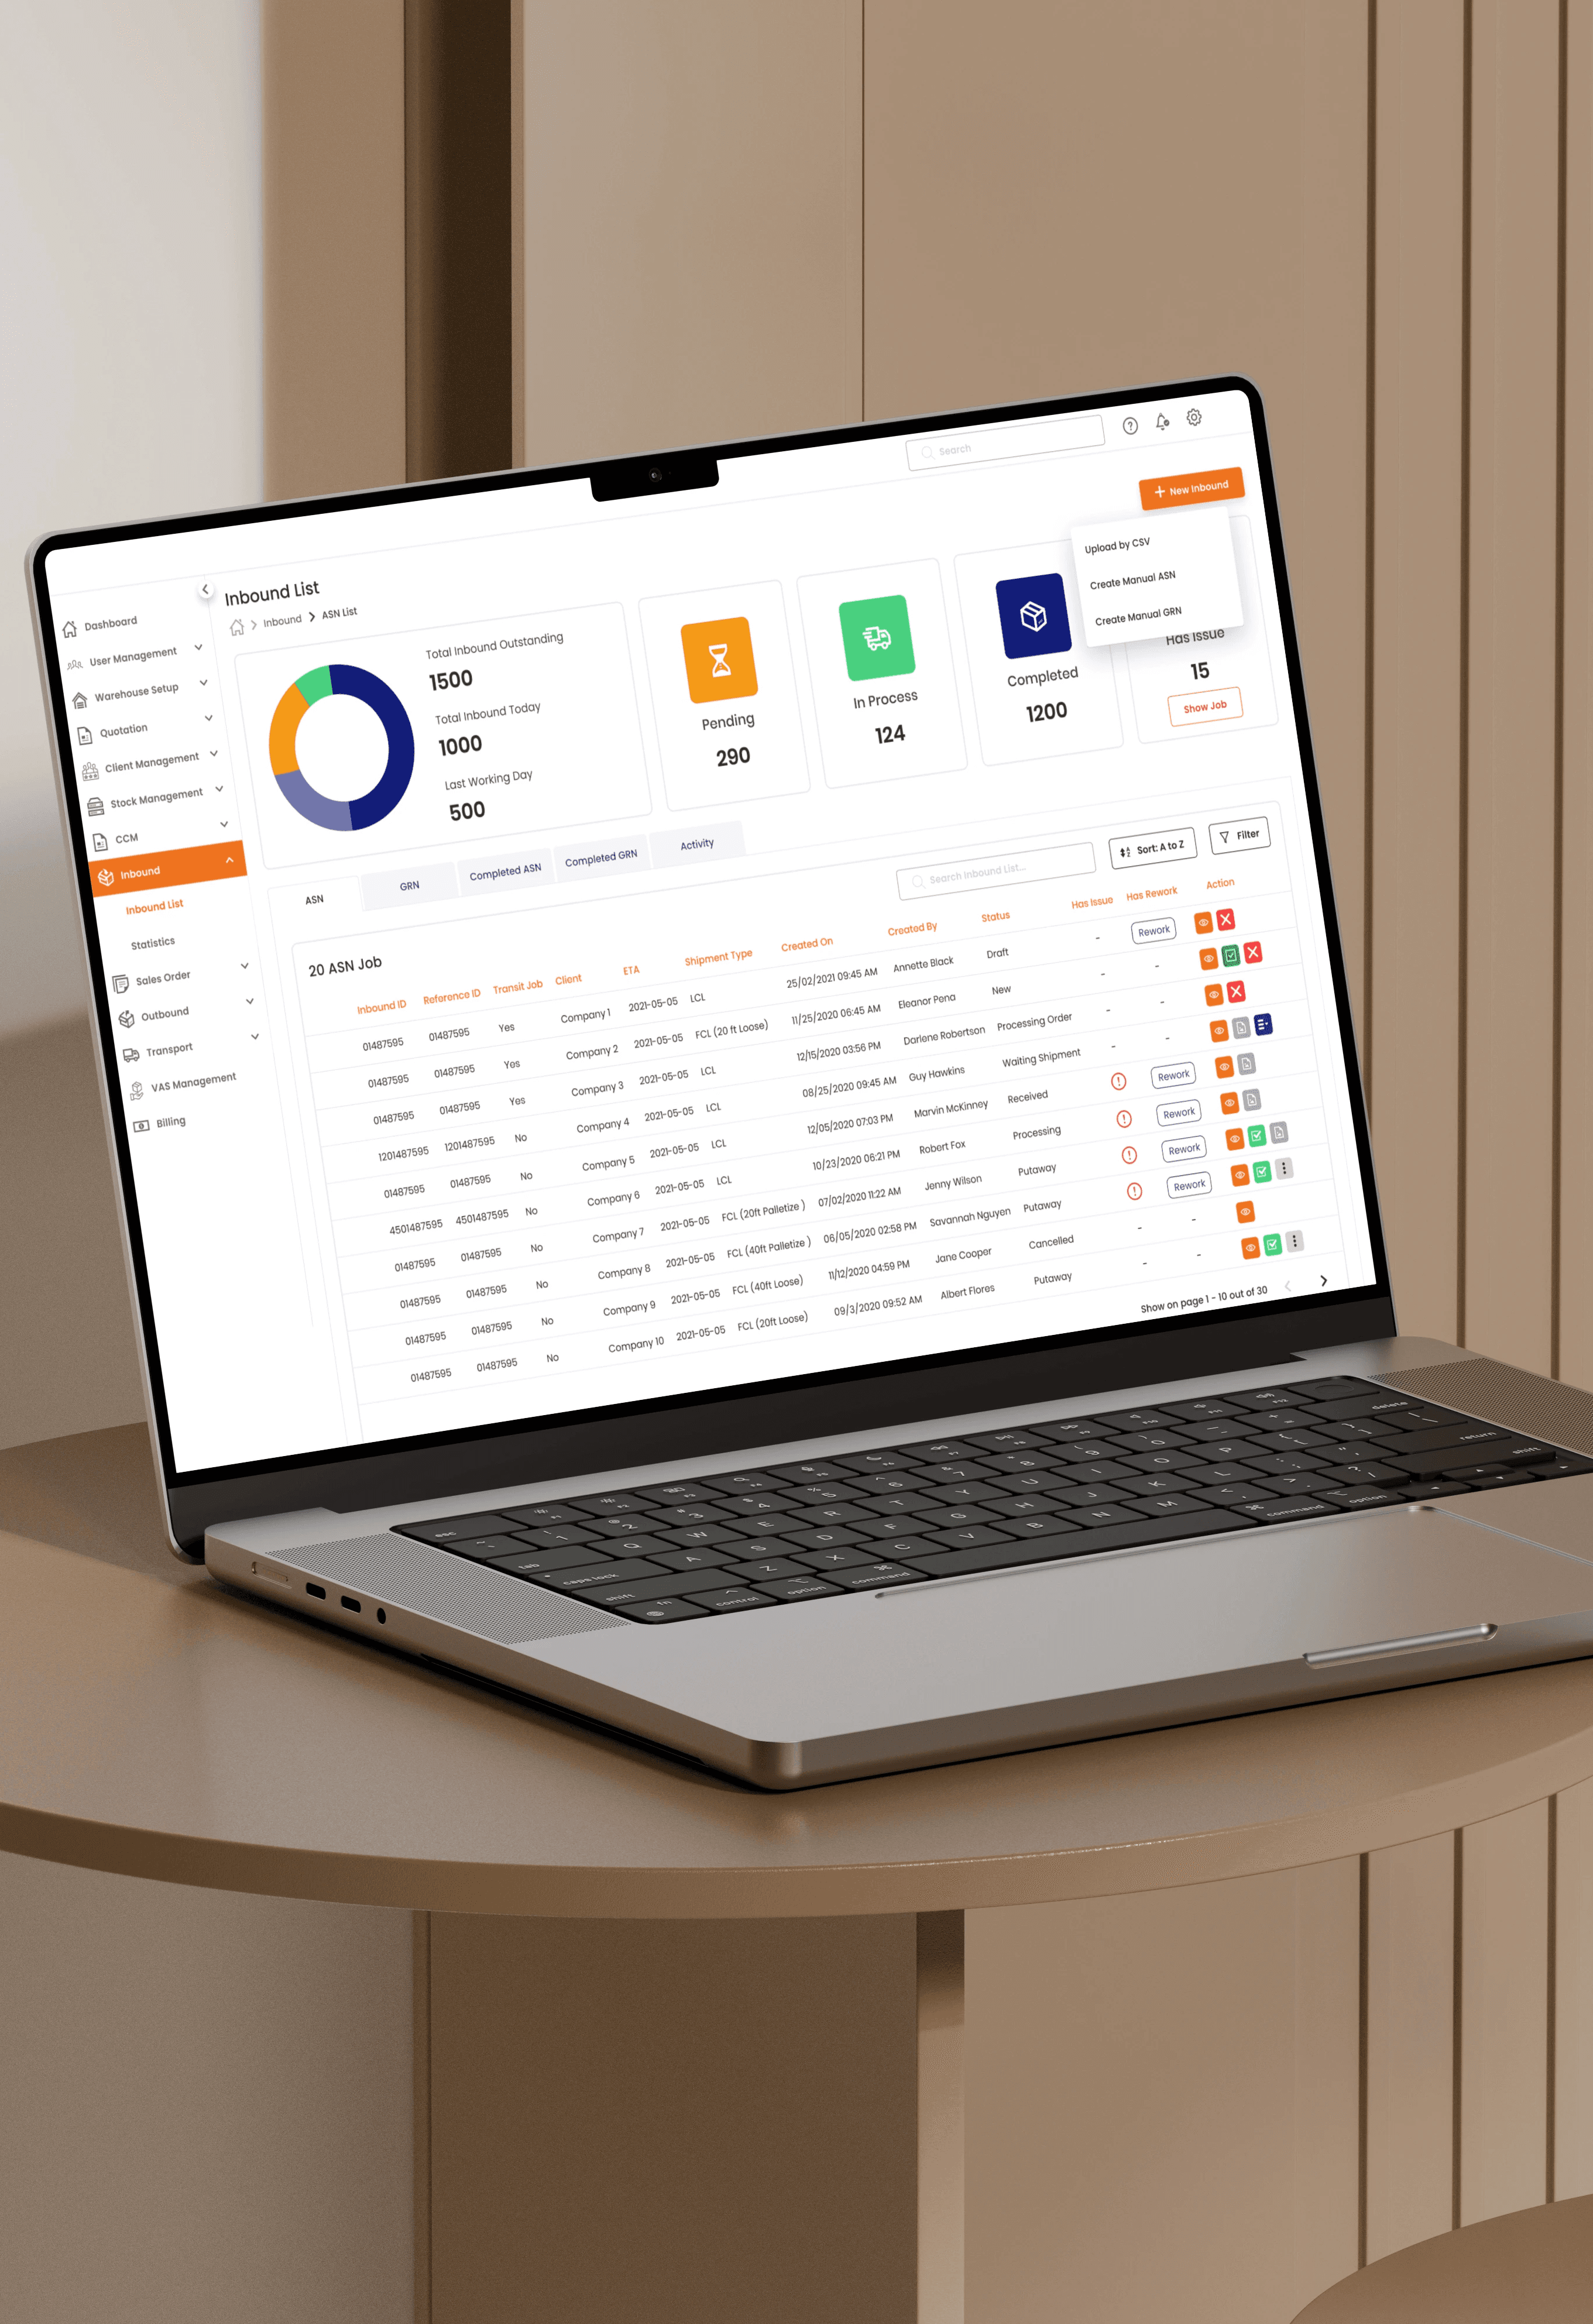
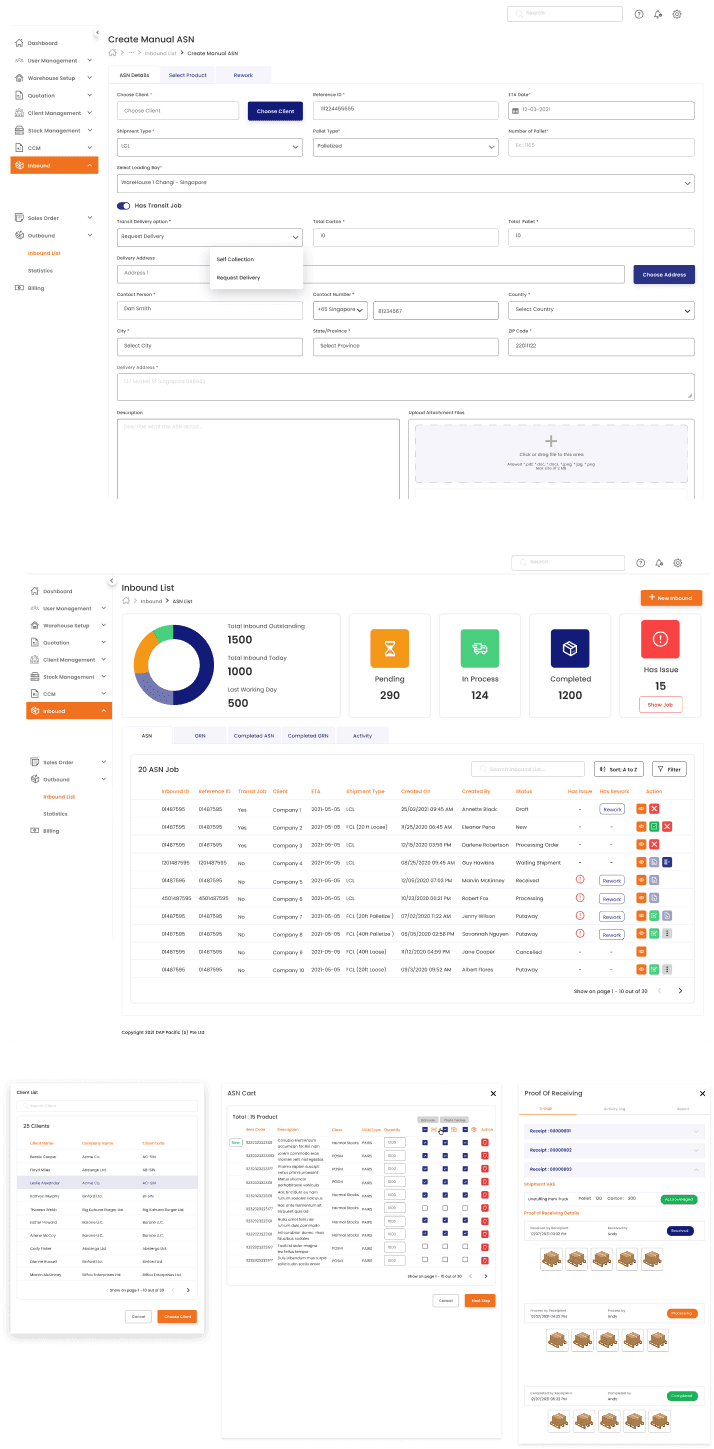
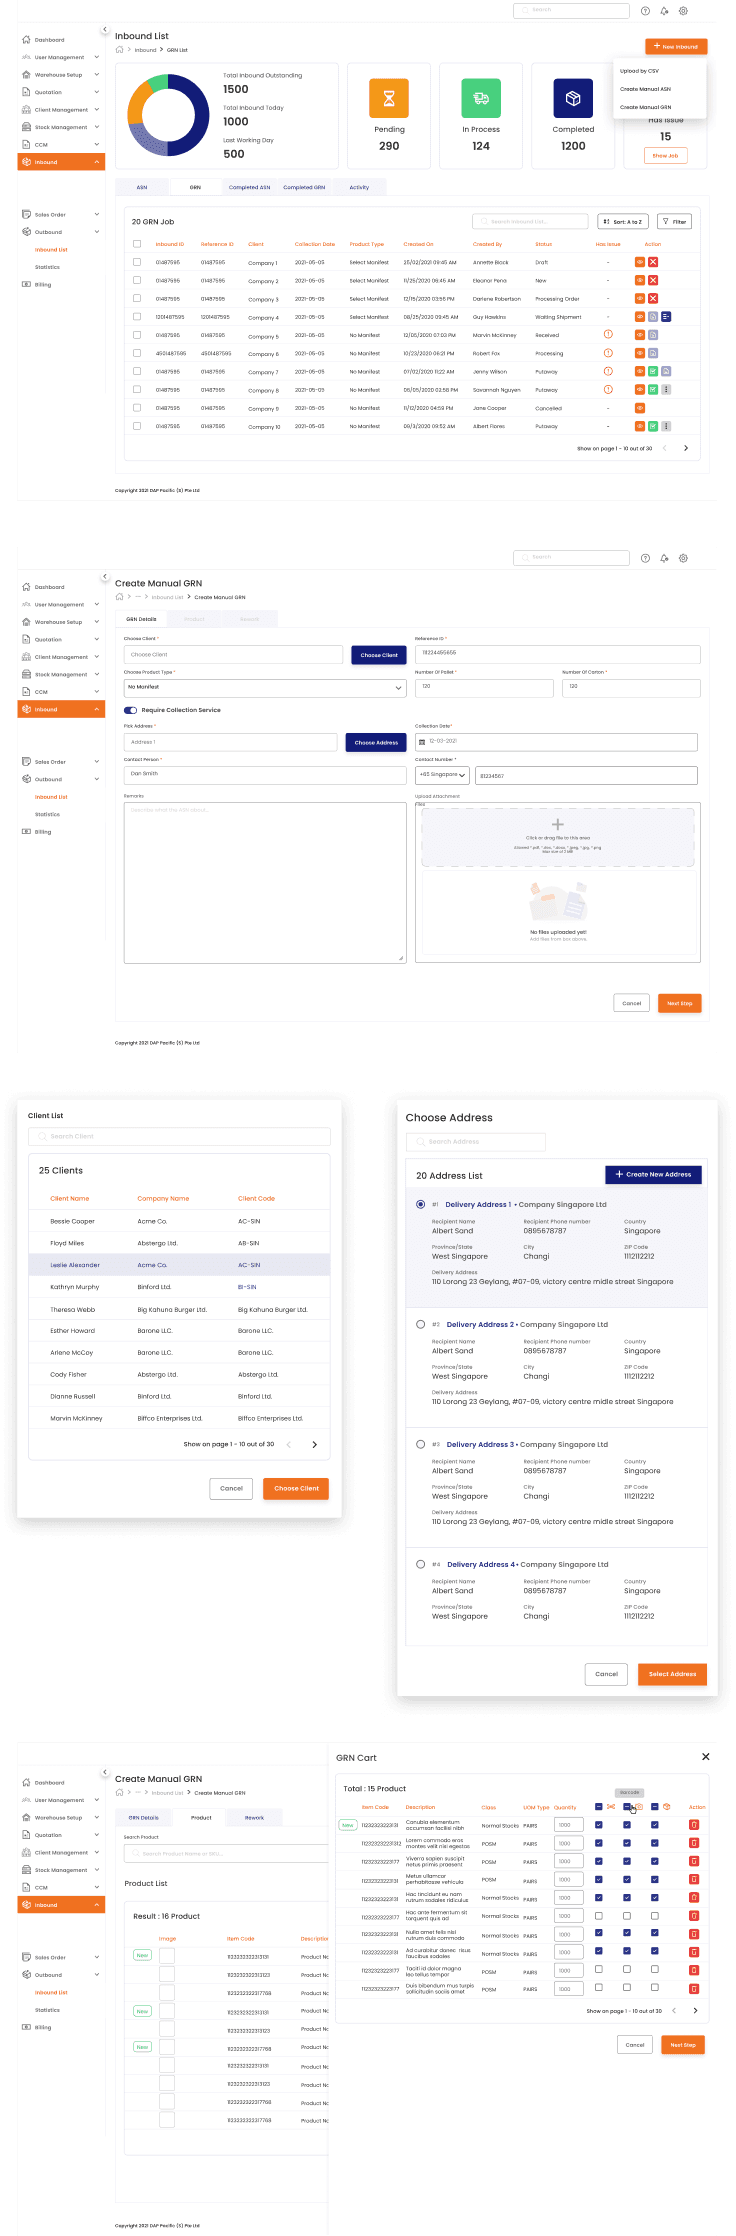
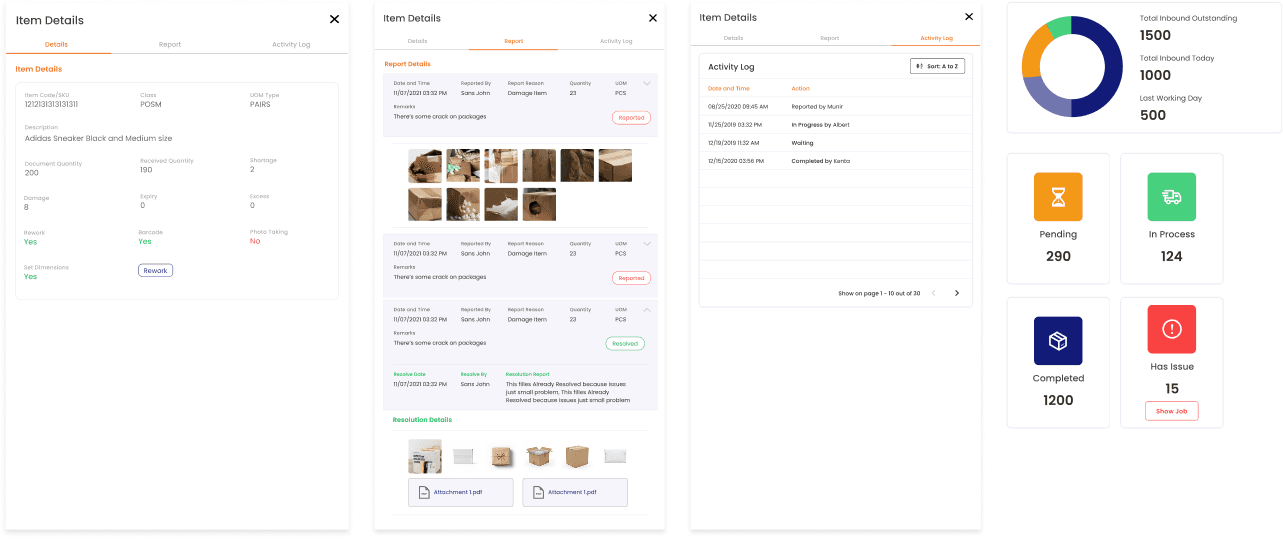
Contextual Inbound Dashboard & Unified ASN Management: Replaced flat data tables with a high-level summary header featuring real-time status counts(Total Inbound, Pending, In Progress, Completed), paired with side-drawer action panels for rapid ASN creation without losing page context.
Streamlined GRN Multi-Tab Inspector & Variance Workflow, Designed a structured tabbed detail drawer (General Info, Line Items, GRN Details, Audit Trail) that auto-calculates variance between expected vs. actual received quantities, highlighting discrepancies in high-visibility alert states.
Smart Dynamic Filtering & Lifecycle Status Matrix, Engineered a multi-parameter filter drawer allowing users to slice inbound volume by Supplier, Dock Location, Date Ranges, and Status. Implemented visually distinct status badges (Draft, Waiting Shipment, In-Transit, Processing, Completed, Cancelled) to provide instant visual scanning.
/ App STRUCTURE
n. 05

App Structure
This diagram maps the end-to-end workflow for managing incoming inventory in a Warehouse Management System (WMS), from pre-arrival planning through physical receiving and final tracking. The Inbound Operations module is organized around three core pillars.
/ USER JOURNEY MAP
n. 06

User Journey Map
This User Journey Map breaks down the inbound warehouse process into 6 sequential stages, matching physical operational tasks with specific user friction points and UX design solutions:
User Action
User thoughts and questions
Gains
Pains
UX
Solutions
ASN Discovery
Filter active shipments on ASN list table
View high-level summary stats
Search & filter list for expected dock
Which shipments arrive today?
Instant list scanning
Sifting through hundreds of stale rows
Dynamic Status Pills & Quick Filter
Create
ASN
Input PO number, supplier, dock, & line items
System auto-fills SKU data
Fill multi-step modal or bulk upload CSV
Are all supplier line items complete?
Auto-filled PO data
Multi-page forms cause typos & lost state
Progressive Modal/Drawer Wizard
Truck
Arrival
Match truck plate with ASN record
Operator receives dock
assignment
Driver arrives, check status on web dashboard
Which dock is open for this carrier?
Fast truck check-in
Congested receiving dock doors
Real-time Dock Allocation Widget
GRN Verification
Open GRN tab view
Confirm received SKU quantity
System flags quantity
mismatch
Verify incoming pallets against digital ASN
Are all SKU counts matching the PO?
Real-time count match
Manual paperwork causes receiving delays
Tabbed GRN Detail Inspector
Variance Logging
Flag missing or damaged items
Attach photo evidence via mobile app
Log variance, upload damage reports
How do I log damaged pallets quickly?
Structured dispute track
High error rates in manual discrepancy notes
Integrated Variance + Attachment Drawer
Putaway & Close
The system automatically updates the status to “Completed” and notifies forklift drivers.
Approve GRN and send stock to storage
Is the ASN marked completed for billing?
Automatic stock update
Auto-putaway delays
Automated Status Progression
Engine
/ WIREFRAME & HIGH FIDELITY
n. 07

Wireframe and High Fidelity
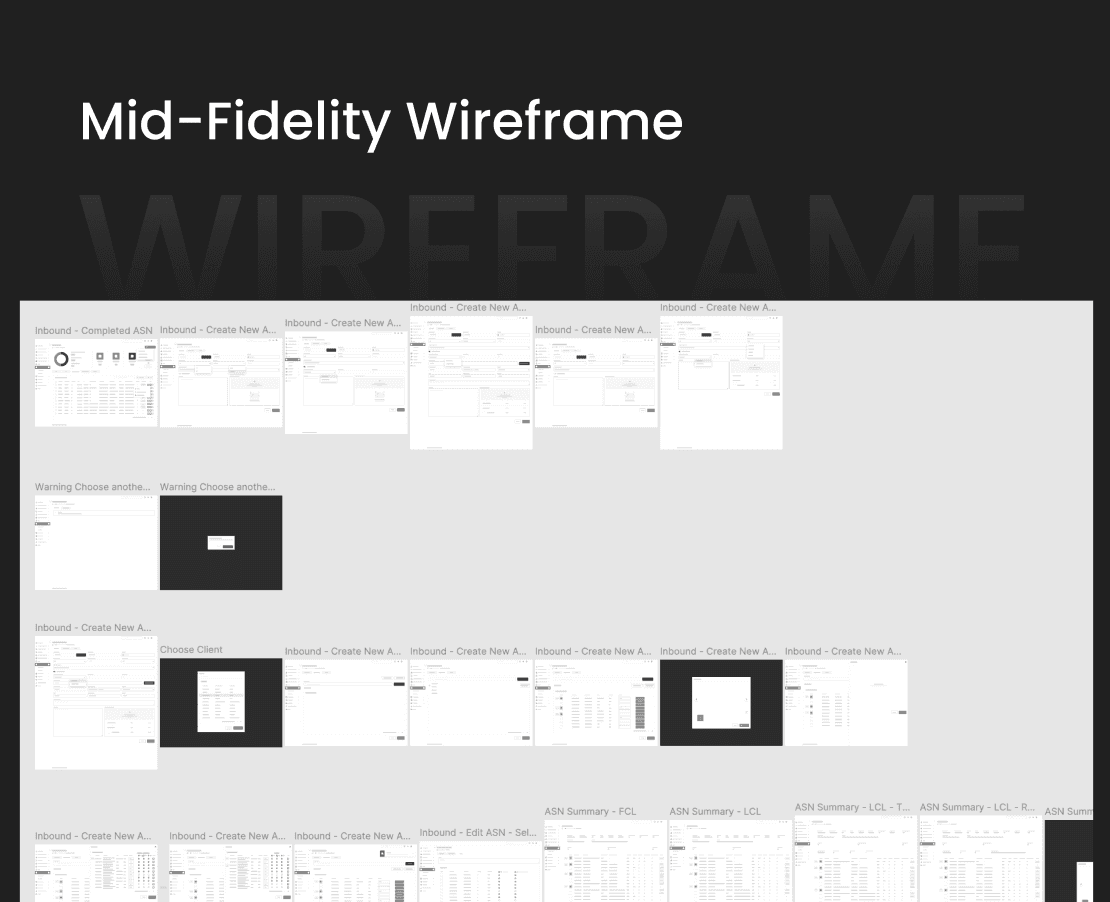
Before committing to high-fidelity visual design, I built interactive wireframe flows in Figma to iterate rapidly with engineering and warehouse ops teams:







/ Validations
n. 09

Validation
I conducted usability evaluations with 8 warehouse operators and 4 logistics leads using high-fidelity prototypes:
99%
Task completion
rate
5/5
Ease-of-use rating,
on a 1 to 5 scale
2.1 min
96%
Positive user reviews
100+ internal app downloads


Quantitative Results
Task Success Rate: Tested complex tasks (e.g., "Create an ASN, apply filters for pending dock 3 shipments, and verify GRN variance"). Success rate increased from 62% on legacy software to 99% on the design.
Time-on-Task Reduction: Average time required to create a new ASN dropped from 6.5 minutes to 2.1 minutes.
Error Rate: Receiving discrepancy errors dropped by 72% due to automated line-item variance calculation.
Qualitative Feedback Highlights
Key Metrics & Business Impact
65% Reduction in ASN Data Entry Errors: Automated PO data pre-filling and guided wizard steps minimized manual typo mistakes.
73% Faster Receiving Dock Turnaround: Streamlined GRN verification sped up truck unloading times from 45 mins to 12 mins per vehicle.
3x Increase in Floor Operator Adoption: Clean visual hierarchy and synced mobile/web workflows led to rapid team adoption across 4 fulfillment centers.
/ Design System
n. 10
Design System
Grow required a complete design system with 53 semantically defined color variables. The component library includes 40+ elements built on that variable system. Poppins was used throughout.


Key Takeaways
What I'd Do Differently
Design for Dense Information, Not Empty Space: In enterprise B2B SaaS, "clean design" doesn't mean white space—it means structured hierarchy, high scannability, and contextual speed.
Handle Edge Cases Upfront: In logistics, variance is the norm (damaged goods, partial shipments, delayed trucks). Designing robust exception-handling flows is what makes a product production-ready.
Bridge Web & Mobile Operations: A successful WMS requires perfect alignment between desktop managers and mobile floor operators. Consistency in status naming and data structures is critical for smooth collaboration.